2.9.1.2. Content
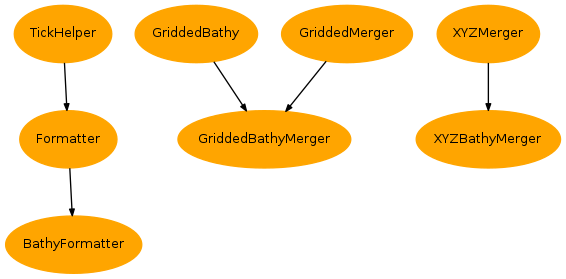
| Inheritance diagram: | |
|---|---|
Bathmetry tools
-
class
Bathy(lon=None, lat=None, name='etopo2', **kwargs)[source]¶ Bases:
objectGet a portion of the gridded bathymetry
Warning
This class is DEPRECATED. Please use
NcGriddedBathyinstead.Params: - lon: Longitude range [default: None]
- lat: Latitude range [default: None]
- sampling: Sampling in both directions [default: 1]
- fill: If True, fill positive values with 0. [default: True]
- mask_function: To mask points. Should be ‘greater’ or ‘less’. If empty or None, no mask is applied [default: ‘greater’]
- mask_value: Value used with mask_function [default: 0.]
- name: Name of bathymetry within is list given by print_bathy_list()
Example: >>> from vacumm import Bathy >>> gg = Bathy((-9,10),(40,50),'etopo2') # object creation >>> gg.show() # quick plot >>> gg.zoom((-5,0),(42,50)) # Select another zoom (lon/lat) >>> mybathyvar = gg() # Get the current zoom >>> mybathyvar = gg((-9,-8),(45,50)) # Get another zoom >>> gg.write_ascii('/home/yoman/mybathy.dat') # dump to file >>> gg.write_netcdf('/home/yoman/mybathy.nc') # same for a netcdf file
-
plot(lon=None, lat=None, **kwargs)¶ Plot the current bathymetry
- lon: Longitude range.
- lat: Latitude range.
See also
-
show(lon=None, lat=None, **kwargs)[source]¶ Plot the current bathymetry
- lon: Longitude range.
- lat: Latitude range.
See also
-
write_ascii(file, fmt='%10f %10f %10f')[source]¶ Write the bathymetry as an ascii file in the format : x y z
- file: Output file name
- fmt: Format of lines [default: ‘%10f %10f %10f’]
-
zoom(lon=None, lat=None, sampling=None, fill=None, mask_function='greater', mask_value=0.0)[source]¶ Select a zoom and set the current variable
Params: - lon: Longitude range [default: None]
- lat: Latitude range [default: None]
- sampling: Sampling in both directions [default: 1]
- fill: If True, fill positive values with 0. [default: True]
- mask_function: To mask points. Should be ‘greater’ or ‘less’. If empty or None, no mask is applied [default: ‘greater’]
- mask_value: Value used with mask_function [default: 0.]
-
plot_bathy(bathy, shadow=True, contour=True, shadow_stretch=1.0, shadow_shapiro=False, show=True, shadow_alpha=1.0, shadow_black=0.3, white_deep=False, nmax=30, m=None, alpha=1.0, zmin=None, zmax=None, **kwargs)[source]¶ Plot a bathymetry
- lon: Longitude range.
- lat: Latitude range.
- show:Display the figure [default: True]
- pcolor: Use pcolor instead of contour [default: False]
- contour: Add line contours [default: True]
- shadow:Plot south-west shadows instead of filled contours.
- nmax: Max number of levels for contours [default: 30]
- white_deep: Deep contours are white [default: False]
- All other keyword are passed to
map2()
-
bathy_list(name=None, cfgfile=None, minstatus=0)[source]¶ Get the list of bathymetries as dict
Params: name, optional: Request this bathymetry.
cfgfile, optional: Load this bathymetry config file.
minstatus, optional: Minimal status of availability of the bathymetry (see
vacumm.config.check_data_file()):0: Bathy file not on disk and not downloadable (however, user can specify the path manually).1: File is not on disk, but downloadable.2: File is on disk.
Return: If
nameis not provided, a dict of subdicts like this one:{'etopo2':{'file':'/home/me/bathy.nc', 'var':'btdata', ...}, ...}
Else, the subdict of the requested bathy:
{'file':'/home/me/bathy.nc', 'var':'btdata', ...}
-
class
XYZBathy(xyz, check_sign=False, *args, **kwargs)[source]¶ Bases:
vacumm.misc.io.XYZFor random bathymetries, like mnt files
- xyz: A (x,y,z) tuple or a xyz file.
- long_name: Long name (like a title) for this bathymetry.
Note
Bathymetry is supposed to be positive over water.
Usage: >>> xzy1 = XZY('bathy1.xzy', long_name='My bathy') # Load >>> xyz1.select([-6,45,-4,48]) >>> xyz1 += XZY('bathy2.xzy') >>> print xyz1.x >>> bathy = xyz1.togrid(mygrid)
See also
XYZshorelineMeanSeaLevel-
clip(zone=None, margin=None, inverse=False, mask=False, id=None, **kwargs)¶ Geographical selection of part of the data
- zone: (xmin,ymin,xmax,ymax) or a float/int a complex polygon (see
polygons()). - margin: Margin around
zonerelative to the resolution (seeresol()) - inverse: Inverse the selection.
- mask:
zonemust be interpreted as a mask
- zone: (xmin,ymin,xmax,ymax) or a float/int a complex polygon (see
-
consolidate()¶ Apply radius undersampling and all exclusions and selections to data and reset them
-
contains(x, y)¶ Check if one or several points are within a the convex hull
- x,y: X,Y positions as floats or lists or an
numpyarrays.
- x,y: X,Y positions as floats or lists or an
-
copy()¶ Deep copy
-
del_rsamp()¶ Reset
rsampwithout affecting data
-
exclude(*zones)¶ Add one or more zones where data are not used.
A zone can be :
- an argument to
polygons()to get a_geoslib.Polygoninstance, - another :class:XYZ` instance from which the convex hull (see
hull()) is used as a delimiting area
Usage: >>> xyz.exclude([[-8,43],[-5.5,43],[-6,45.]],[[-10,45],[-7,47],[-10,49.]]) >>> xyz.exclude(polygon1,polygon2) >>> xyz.exclude(xyz1,[-5,42,-3,48.])
See also
- an argument to
-
exclusions()¶ Get all exclusion polygons as a tuple
-
get_grid(res=None, xmin=None, xmax=None, ymin=None, ymax=None, relres=0.5, degres=False, id='xyz_grid')¶ Generate a rectangular grid based on x/y positions and resolution
res: Resolution. It can be:
relres: Relative resolution factor applied to
reswhen resolution is guessed (res=None)degres: When
resis explicitly given, it interpreted as degrees isdegresis True.xmin,xmax,ymin,ymax: Bounds of the grid. If not specified, bounds of the dataset are used (see
xmin(), etc).
Note
Resolutions are adjusted when they are not mutiple of grid extensions (slightly decreased). Therefore, extensions of the grid are always preserved.
-
get_res(deg=False, auto=None)¶ Get the mean X and Y resolutions in meters or degrees
-
get_rsamp()¶ Get the radius sampling
rsamp
-
get_x(mask=True)¶ Get valid X positions
-
get_xmax(mask=True)
-
get_xmin(mask=True)
-
get_xyz(mask=True, split=False)¶ Return coordinates and data as a (3, npts) array
xyzxy()[0]: Xxy()[1]: Yxy()[2]: Z
-
get_y(mask=True)¶ Get valid Y positions
-
get_ymax(mask=True)
-
get_ymin(mask=True)
-
get_z(mask=True)¶ Get valid Z values
-
get_zmax(mask=True)
-
get_zmin(mask=True)
-
grid¶ Rectangular grid based on x/y positions and resolution
-
hull(out='xy', mask=True)¶ Return the convex hull
Returns: Depends on out"xy": (xhull, yhull)"ind": indices of points"poly":_geoslib.Polygoninstance
-
interp(xyo, xyz=False, **kwargs)¶ Interpolate to (xo,yo) positions using
nat.NatgridParams: - xo: Output X
- yo: Output Y
- xyz: If True, return a
XYZinstance instead of anumpyarray - interp_<param>, optional:
<param>is passed to thexy2xy()interpolation routine. - Other params are passed to XYZ initialization for the output dataset.
Returns: An XYZ instance
-
magnet¶ Magnet integer attribute
-
mask()¶ Get the current mask due to exclusion and selection polygons
-
plot(m=True, **kwargs)[source]¶ Scatter plot of bathymetry points
Params: - mode, optional: ‘valid’, ‘masked’ or ‘both’.
- size, optional: Size of markers.
- color, optional: Color of markers.
- alpha, optional: Alpha transparency of markers.
- zorder, optional: zorder of markers.
- m, optional: Use this
Basemapinstance to plot the points. - masked_size, optional: Size of masked markers.
- masked_alpha, optional: Alpha transparency of masked markers.
- masked_zorder, optional: zorder of masked markers.
See also
For value of default parameters:
plot()
-
reset_exclusions()¶ Remove all exclusions
-
reset_rsamp()¶ Reset
rsampwithout affecting data
-
reset_selections()¶ Remove all selections
-
resol(convex_hull_method='delaunay', exc=[], deg=False)¶ Return the mean resolution.
Algorithm: Median distances between facets of triangles
Returns: (xres,yres)
-
rsmap¶ Radius of unsersampling
-
save(xyzfile, **kwargs)¶ Save to a file
xyzfile: Output file name
- write a netcdf file if it ends with “.nc” or “.grd”
- write a sinux file if it ends with “.snx”
- else write an ascii file with 3 columns
Other keywords are passed to
numpy.savetxt()for ascii saving
-
select(*zones)¶ Add one or more zone (polygons) where only these data are used
A zone is an argument to
polygons()to get a_geoslib.Polygoninstance.Usage: >>> xyz.select([[-8,43],[-5.5,43],[-6,45.]],[[-10,45],[-7,47],[-10,49.]]) >>> xyz.select(polygon1,polygon2)
See also
-
selections()¶ Get all selection polygons as a tuple
-
set_magnet(magnet)¶ Set the magnet integer attribute. If set to
0, no magnet effect.Note
Useful only for mixing
XYZinstances
-
set_res(xres, yres=None)¶ Set the resolution of the dataset
If
yresis not, it is set toxres. When a value is negative, it is supposed to be in meters (not in degrees)
-
set_rsamp(rsamp)¶ Set the radius sampling
rsampIf set to0, no sampling.
-
shadows()¶ Get the polygons defining the ‘shadow’ of this dataset.
It consists of a tuple of two elements:
- the convex hull as a polygon,
- a list of exclusion polygons that intersect the convex hull.
Therefore, a point in the shadow must be inside the convex hull polygon, and outside the exclusion polygons.
Returns: (hull_poly, [exclusion_poly1,…])
-
tocfg(cfg, section, param=None)¶ Dump one or all parameters as options to a cfg section
- cfg: ConfigParser object
- section: Section of cfg
- param: A single or a list of parameter names
-
togrid(grid=None, mask=None, cgrid=False, proj=None, **kwargs)[source]¶ Interpolate to a regular grid
grid: The output grid. It can be either:
- a (x,y) tuple or a grid or a
MV2variable with a grid, None, thus guessed usinggrid()
- a (x,y) tuple or a grid or a
mask: It can be either:
None,FalseorMV2.nomask: no masking- an array: this mask array is directly applied
- a
Shapesinstance (orShoreLine) or a single char GSHHS resolution (and optionally ‘s’ for Histolitt) - a callable fonction so that
mask = thisfunc(mask, **kwmask) - a float: data with this value are masked
mask_<param>: <param> is passed to
polygon_mask()for evaluation of mask thanks to the polygons.grid_<param>: <param> is passed to
grid().cgrid: If
True, returns bathy at U- and V-points, else at T-pointsOther keyparam are passed to
griddata()for regridding.
Return:
(Zx,Zy)ORZdepending on cgrid.
-
toxy(xo, yo, mask=None, outtype='tuple')¶ Interpolate on random points using
xy2xy()xo,yo: Output positions
mask: It can be either:
None,FalseorMV2.nomask: no masking- a
Shapesinstance (orShoreLine) or a single char GSHHS resolution (and optionally ‘s’ for Histolitt)
outtype: Define output type
"tuple": as a tuple (x, y, z)"xyz": as xyz block"XYZ": as anXYZ(or subclass) instance
-
transp¶ Transparency boolean attribute
-
x¶ Valid X positions
-
xmax¶ X max
-
xmin¶ X min
-
xy¶ Coordinates as a (2, npts) array
-
xyz¶ Coordinates and data as a (3, npts) array
-
y¶ Valid Y positions
-
ymax¶ Y max
-
ymin¶ Y min
-
z¶ Valid Z values
-
zmax¶ Z max
-
zmin¶ Z min
-
zone(poly=False, mask=True)¶ Get xmin,ymin,xmax,ymax
- poly: if True, return zone as a Polygon instance
-
class
XYZBathyBankClient(bank, id, **kwargs)[source]¶ Bases:
objectAn single element (bathy infos) of the
XYZBathyBank- bank: A bank instance.
- id:Id of this bathy.
- Other keywords are set as attributes (like long_name, etc).
Usage: Let
xyzbcbeing an element of the bank.>>> print xyzbc >>> xyzbc.long_name = 'New long name' >>> xyzbc.xmax = -2. >>> xyzbc.transp = False >>> xyzbc.id = 'iroise' # Rename in the bank >>> xyzbc.xyzfile = 'newfile.mnt' # xmin, xmax, ymin, ymax updated >>> xyz = xyzbc.load()
-
class
XYZBathyBank(cfgfile=None)[source]¶ Bases:
objectBank of XYZ bathymetry infos
See also
Usage: >>> xyzb = XYZBathyBank()
-
add(xyzfile, id=None, force=False, **kwargs)[source]¶ Add a bathy to the bank
- xyzfile: xyz file.
- id: Id of the bank. If
None, it is guessed from the file name: xyzfile="/path/toto.xyz"->id="toto"
- id: Id of the bank. If
-
merger(**kwargs)[source]¶ Return a
XYZBathyMergerinstance using the current bankKeywords are passed to
select()
-
plot(**kwargs)[source]¶ Plot current bathies using a
XYZBathyMergerinstance
-
remove(id)[source]¶ Remove a bathy from the bank
id: A bathy id or
XYZBathyBankClientinstance.
-
select(xmin=None, xmax=None, ymin=None, ymax=None, load=True, margin=None, ordered=None)[source]¶ Return a list of bathymetries relevant to the specified region
margin: Margin for loading xyz bathies:
- if None, the whole bathy is loaded from the bank,
- else it should be a value relative to the approximative resolution (see
XYZBathy.resol())
-
-
class
XYZBathyMerger(xmin=None, xmax=None, ymin=None, ymax=None, long_name=None)[source]¶ Bases:
vacumm.misc.io.XYZMergerMix different bathymetries
-
append(d)¶ Append a dataset to the merger
-
clean()¶ Remove all current dataset
-
copy()
-
from_bank(margin=5)[source]¶ Append all bathymetries from the bank that cover the grid
All parameters are passed to
XYZBathyBank.select()
-
get_xyz(mask=True, **kwargs)¶ Merge current dataset
-
ids()
-
plot(color=None, marker=None, mode='cluster', title='XYZ merger', m=True, show=True, colorbar=True, savefig=None, savefigs=None, **kwargs)[source]¶ alpha: Alpha transparency:
- applied to all points if
mode="cluster" - applied to hidden points if
mode="data"
- applied to all points if
mode: Display mode:
"cluster": Points from different datasets have different colors and markers,- and hidden points are transparent.
"data": Points have the same marker, colors depends on Z value and hidden- points are masked.
marker: Define a single or several markers to be used.
legend: Show a legend if
mode="cluster".title: Title of the plot.
m:
Basemapinstance.m_margin: Margin for
m, relative to the mean resolution (seeXYZ.resol())m_<keywords>: Keywords are passed to
map().Extra keywords are passed to
XYZ.plot().
-
remove(d)¶ Remove a dataset from the merger
-
togrid(*args, **kwargs)¶ Interpolate merged bathymetries to a grid
-
tolist()¶ Return the merger as a list of datasets
-
xyz¶ Coordinates and data as a (3, npts) array
-
-
class
GriddedBathy(var, maxvalue=0.0, fillvalue=0.0, shoreline=None)[source]¶ Bases:
vacumm.bathy.bathy._GriddedBathyMasked_Interface to gridded bathymetries
Usage: >>> b = GriddedBathy(var, shoreline='f') >>> b.plot_bathy(title='Bathymetry') >>> b.save('bathy.nc') >>> newvar = b.bathy(mask=True)
-
bathy(mask=True, id=None, long_name=None)[source]¶ Get the bathymetry variable
Params: - mask: If True and if a shoreline is set (with
set_shoreline()), apply a mask due to this shoreline.
- mask: If True and if a shoreline is set (with
-
get_shoreline_mask()¶ Get the shoreline mask
-
masked_bathy(id=None, long_name=None)¶ Get a masked version of the bathymetry
-
plot(mask=True, id=None, long_name=None, **kwargs)[source]¶ Plot using
plot_bathy()
-
regrid(grid, method='auto', mask=True, id=None, long_name=None, **kwargs)[source]¶ Regrid bathy to another grid
-
reset_shoreline()¶ Remove the shoreline
-
save(ncfile, mask=True, **kwargs)[source]¶ Save bathy to a netcdf file
Params: - ncfile: Output netcdf file name
- Other keywords are passed to
bathy()
-
set_fillvalue(fillvalue)¶ Set filling value when bathy is masked.
Params: - fillvalue: If not set to a scalar, bathy is not filled when masked.
-
set_maxvalue(maxvalue)¶ Set the value over which bathy is masked.
Params: - maxvalue: If not set to a scalar, bathy is not masked in this way.
-
set_shoreline(shoreline, margin=None)¶ Set the shoreline that to create a mask
Params: - shoreline:
'auto',ShoreLineinstance, argument toget_shoreline(). IfNoneorFalse, shoreline is not used.
Note
The mask is applied only if
masked_bathy()is called.- shoreline:
-
-
class
GriddedBathyMerger(grid, shoreline=None, id=None, long_name=None, maxvalue=0.0, fillvalue=0.0)[source]¶ Bases:
vacumm.misc.grid.regridding.GriddedMerger,vacumm.bathy.bathy.GriddedBathyMerger of gridded variables
Usage: >>> merger = GriddedMerger(mygrid, long_name='My bathy') >>> merger += etopo2(lon=(-10,0),lat=(42,50)) >>> merger += my_bathy >>> merger.set_shoreline('i') >>> merged_bathy = merger.bathy()
-
append(var, method='auto', **kwargs)¶ Append a bathymetry to the top of the merger
-
get_grid()¶ Get the grid for merging
-
get_lat()¶ Get the loatitudes of the grid
-
get_lon()¶ Get the longitudes of the grid
-
get_res()
-
get_shoreline_mask()¶ Get the shoreline mask
-
insert(idx, var)
-
masked_bathy(id=None, long_name=None)¶ Get a masked version of the bathymetry
-
merge(res_ratio=0.5, mask=True, id=None, long_name=None)[source]¶ Merge all variables onto the grid and apply final mask
-
regrid(grid, method='auto', mask=True, id=None, long_name=None, **kwargs)¶ Regrid bathy to another grid
-
remove(var)
-
reset_shoreline()¶ Remove the shoreline
-
save(ncfile, mask=True, **kwargs)¶ Save bathy to a netcdf file
Params: - ncfile: Output netcdf file name
- Other keywords are passed to
bathy()
-
set_fillvalue(fillvalue)¶ Set filling value when bathy is masked.
Params: - fillvalue: If not set to a scalar, bathy is not filled when masked.
-
set_grid(grid)¶ Set the grid for merging
-
set_maxvalue(maxvalue)¶ Set the value over which bathy is masked.
Params: - maxvalue: If not set to a scalar, bathy is not masked in this way.
-
set_shoreline(shoreline, margin=None)¶ Set the shoreline that to create a mask
Params: - shoreline:
'auto',ShoreLineinstance, argument toget_shoreline(). IfNoneorFalse, shoreline is not used.
Note
The mask is applied only if
masked_bathy()is called.- shoreline:
-
-
class
NcGriddedBathy(lon=None, lat=None, name=None, cfgfile=None, reverse=False, varname=None, lonname=None, latname=None, shoreline=None, maxvalue=0.0, fillvalue=0.0, imargin=0, jmargin=0, **kwargs)[source]¶ Bases:
vacumm.bathy.bathy.GriddedBathyGet a gridded bathymetry from file
Params: lon/lat, optional: Longitude and latitude selection.
name, optional: It is either
- the name of bathymetry within the list given by
print_bathy_list() - the name of netcdf file.
- the name of bathymetry within the list given by
i/jmargin: Add or suppress a marginal grid points to the selected area (integer).
Example: >>> b = NcGriddedBathy(lon=(-6,-4), lat=(48,49), maxvalue=None) >>> b.save('bathy.nc') >>> b.regrid(mygrid) >>> b.plot(savefig='bathy.png') >>> b2 = NcGriddedBathy(name='bathy.nc')
-
bathy(mask=True, id=None, long_name=None)¶ Get the bathymetry variable
Params: - mask: If True and if a shoreline is set (with
set_shoreline()), apply a mask due to this shoreline.
- mask: If True and if a shoreline is set (with
-
get_grid()
-
get_lat()
-
get_lon()
-
get_res()
-
get_shoreline_mask()¶ Get the shoreline mask
-
masked_bathy(id=None, long_name=None)¶ Get a masked version of the bathymetry
-
plot(mask=True, id=None, long_name=None, **kwargs)¶ Plot using
plot_bathy()
-
regrid(grid, method='auto', mask=True, id=None, long_name=None, **kwargs)¶ Regrid bathy to another grid
-
reset_shoreline()¶ Remove the shoreline
-
save(ncfile, mask=True, **kwargs)¶ Save bathy to a netcdf file
Params: - ncfile: Output netcdf file name
- Other keywords are passed to
bathy()
-
set_fillvalue(fillvalue)¶ Set filling value when bathy is masked.
Params: - fillvalue: If not set to a scalar, bathy is not filled when masked.
-
set_maxvalue(maxvalue)¶ Set the value over which bathy is masked.
Params: - maxvalue: If not set to a scalar, bathy is not masked in this way.
-
set_shoreline(shoreline, margin=None)¶ Set the shoreline that to create a mask
Params: - shoreline:
'auto',ShoreLineinstance, argument toget_shoreline(). IfNoneorFalse, shoreline is not used.
Note
The mask is applied only if
masked_bathy()is called.- shoreline:
-
exception
NcGriddedBathyError[source]¶ Bases:
exceptions.Exception-
args
-
message
-